
Williams Lake has once again cracked the top 10 of Maclean’s Magazine’s annual Canada’s Most Dangerous Places to Live list.
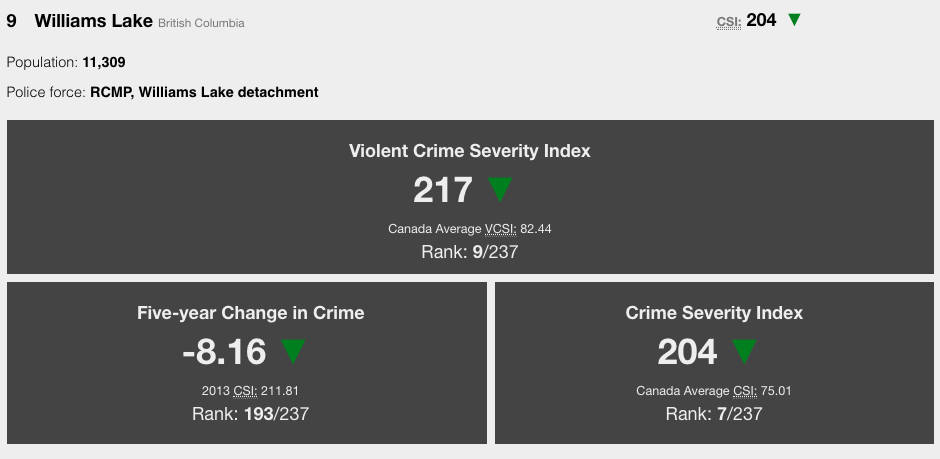
Based on statistics of violent crimes committed in the city, Williams Lake ranked ninth highest out of 237 communities in the country, despite receiving a lower violent crime severity index than in 2018 where Williams Lake ranked seventh in the nation.
Quesnel, meanwhile, ranked fifth on the list.
According to Maclean’s Magazine’s annual Crime Severity Index (CSI) report released this week, Williams Lake saw an increase in 2019 from 2018 in drug offences including impaired driving, cannabis trafficking, cocaine trafficking and other controlled drug trafficking or production, sexual assaults and fraud.
READ MORE: Williams Lake named fourth ‘most dangerous’ in Canada
Homicides, assaults, firearms offences, robberies, breaking and entering and youth criminal justice act offences, meanwhile, were down from 2018.
The CSI data is compiled from within the actual City of Williams Lake boundaries.
The ranking has long been a thorn in the side of Williams Lake’s politicians, who have argued for better representation of crime statistics based on the city and its outlying areas for population.
In March of 2019, the city’s Chief Administrative Officer Milo Macdonald said the crime severity index for Williams Lake is artificially attributing the crime rate of roughly 30,000 people to a population of around 10,000 people. He added while those areas are outside of the political boundaries of Williams Lake, they are functionally still part of the community.
At this week’s city council meeting, prior to the release of the rankings, council pushed for GPS monitoring on prolific and domestic violent offenders.
The actual rates listed in the report are as follows:
Homicide, Assault and Bodily Harm
• Homicide, actual incidents: 1
• Homicide rate (incidents per 100,000 population): 8.84 (Canada avg.: 1.76)
• Assault, actual incidents: 129
• Assault rate (incidents per 100,000 population): 1,140.68 (Canada avg.: 457.01)
• Sexual assault, actual incidents: 27
• Sexual assault rate (incidents per 100,000 population): 238.75 (Canada avg.: 75.89)
• Firearms offences, actual incidents: 2
• Firearms offences rate (incidents per 100,000 population): 17.69 (Canada avg.: 7.58)
Theft and Property Crime
• Robbery, actual incidents: 19
• Robbery rate (incidents per 100,000 population): 168.01 (Canada avg.: 60.58)
• Breaking and entering, actual incidents: 98
• Breaking and entering rate (incidents per 100,000 populations): 866.57 (Canada avg.: 431.24)
• Fraud, actual incidents: 95
• Fraud rate (incidents per 100,000 population): 840.04 (Canada avg.: 349.2)
Drug Offences
• Impaired driving, actual incidents: 61
• Impaired driving rate (incidents per 100,000 population): 539.39 (Canada avg.: 190.49)
• Cannabis trafficking or production, actual incidents: 8
• Cannabis trafficking or production rate (incidents per 100,000 population): 70.74 (Canada avg.: 22.5)
• Cocaine trafficking or production, actual incidents: 11
• Cocaine trafficking or production rate (incidents per 100,00 population): 97.27 (Canada avg.: 20.03)
• Other controlled drugs, trafficking or production, actual incidents: 5
• Other controlled drugs, trafficking or production rate (incidents per 100,000 population): 44.1 (Canada avg.: 31.58)
Youth Crime
• Youth Criminal Justice Act offences, actual incidents: 1
• Youth Criminal Justice Act offences rate (incidents per 100,000 population): 8.84 (Canada avg.: 13.01)
What is the CSI?
According to Statistics Canada (StatsCan), the Crime Severity Index tracks changes in the severity of police-reported crime.
StatsCan takes into consideration the number of crimes as well as the seriousness of those crimes to generate the CSI.
To do this, crimes are weighted according to their severity – more serious crimes are assigned higher weights, less serious offences lower weights. For example, a murder would receive a weight 1,000 times higher than a case of shoplifting.
READ MORE: Crime severity index sees Williams Lake seventh place
The weight consists of two parts – the number of people convicted and sentenced to time in prison, multiplied by the average time they spend in prison.
Each crime receives the same weight regardless of the specific outcome of any individual case – for example, all robberies reported by police carry the same weight in the CSI. The weights are calculated using the five most recent years of available sentencing data.
To finally calculate the CSI, the number of crimes is multiplied by the weight for that crime, the final figure divided by the corresponding population total. To make the CSI easier to interpret, it is standardized to 100 for Canada.
Do you have a comment about this story? email:
editor@wltribune.com
Like us on Facebook and follow us on Twitter.