Jim HILTON
Special the Tribune
The first 45-page report out out by the Cariboo Regional District on their wildfire consultations contains lots of charts and pictures and summarizes the more detailed material in the 352 page appendix. It is worthwhile to review both reports as there are interesting areas in both. There are a couple of sections in the reports that I found of particular interest because I have been working with a number of remote sensing tools to look at last year’s wildfires.
For example the section on page 42 of the report titled “Culture of Preparedness” and the attached 12 recommendations deals with wild land urban interface issues. Recommendation number four talks about creating and maintaining fire breaks around communities and number nine talks about how individuals and communities must take the lead in preparedness and approach the municipalities for guidance, training and assistance.
There is also an interesting map on page 331 of the appendix report titled “Plateau fire (western extent) burn severity map, September 04, 2017 11.00pt.” It is also called a “Rapid Burned Area Map” (RBAM Beta). It goes on to describe how the burn severity map shows a Relativized Burn Ratio Index (RBR) calculated from Sentinal-2 images acquired 2016-05-14 and 2017-09-04 both at 11.00 pt. The colour map shows three levels of burn intensity low, moderate and high severity.
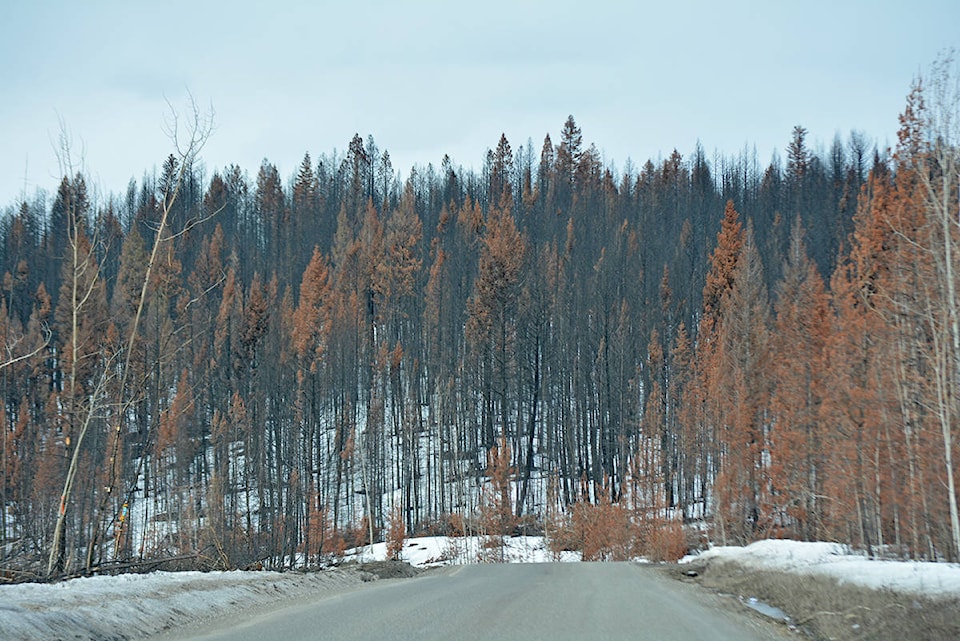
For the purposes of the report the map was produced at a scale of 1:300,000 so it is difficult to see details that would help to interpret the map but there are a number of photos which show the various levels of burn intensity which gives some idea how devastating the high severity burns were.
My estimate is that the high and moderate severity make up one third of the total area burned. It will take a larger scale map and ground checks to determine what areas escaped the more intense burns. Most of the potential salvage opportunities will be in the moderate to low intensity burns.
I have been using two remote sensing tools to look at the development of the wildfires in the Cariboo region. By overlaying the NASA, Active Fire Data (MODIS and VIIRS) on top of the Sentinal satellite images it possible to see how the fires progressed on a daily basis. I am trying to see if there is a particular forest type that is more resistant to the fire advance and what forest types the fires burned with less intensity.
Using the RBAM map discussed above and some of the other satellite tools it should be possible to see what forest types (ages, densities etc.) are more resistant to the fires and provide some ideas as to what combinations maybe more resistant to mega fires as well as how we incorporate fire guards into the landscape to attain maximum protection and still retain traditional forest values.
Looking at some of the images so far it is unlikely that any forest types will resist a high ranking fire but some types may be more resistant at night or when the winds decrease and humidity increases. With close to a million hectares burned in the Cariboo alone there are plenty of areas to study with the intent of using severely burned areas and more resistant areas to provide natural fire breaks for helping control future wildfires.
Jim Hilton is a professional agrologist and forester who has lived and worked in the Cariboo Chilcotin for the past 40 years. Now retired, Hilton still volunteers his skills with local community forests organizations.